Today we are going to be working with complex numbers. In Maple, we represent
the complex number $i = \sqrt{-1}$ by the symbol I. From your calculus
class you should know that
\[ e^x = 1 + \frac{x^1}{1!} + \frac{x^2}{2!} + \frac{x^3}{3!} + \frac{x^4}{4!} + \cdots \]
\[ cos(x) = 1 - \frac{x^2}{2!} + \frac{x^4}{4!} - \frac{x^6}{6!} + \frac{x^8}{8!} + \cdots \]
\[ sin(x) = \frac{x^1}{1!} - \frac{x^3}{3!} + \frac{x^5}{5!} - \frac{x^7}{7!} + \cdots \]
and so it is easy to see that
\[ e^{i x} = 1 + i \frac{x^1}{1!} - \frac{x^2}{2!} - i \frac{x^3}{3!} + \frac{x^4}{4!} + \cdots = cos(x) + i sin(x) \]
A number is called complex if it is of the form $a + ib$ where $a$ and $b$ are real
numbers. Any complex number represented as $a+ bi = r e^{ix}$ where
$r = \sqrt{a^2 + b^2}$ and $x = arccos\left( \frac{a}{\sqrt{a^2+b^2}} \right)$.
Question #1:
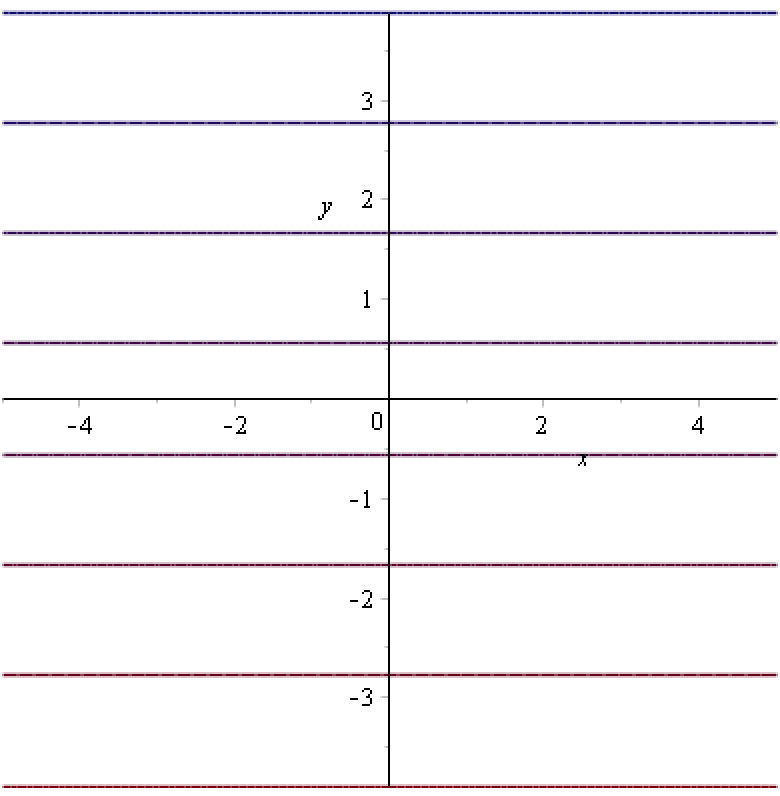
One of the examples above is a contourplot of a flat plane. Step 1: write a function
f1 such that when you do the command contourplot(f1(x+I*y),x=-2..2,y=-2..2)
that you see the picture below.
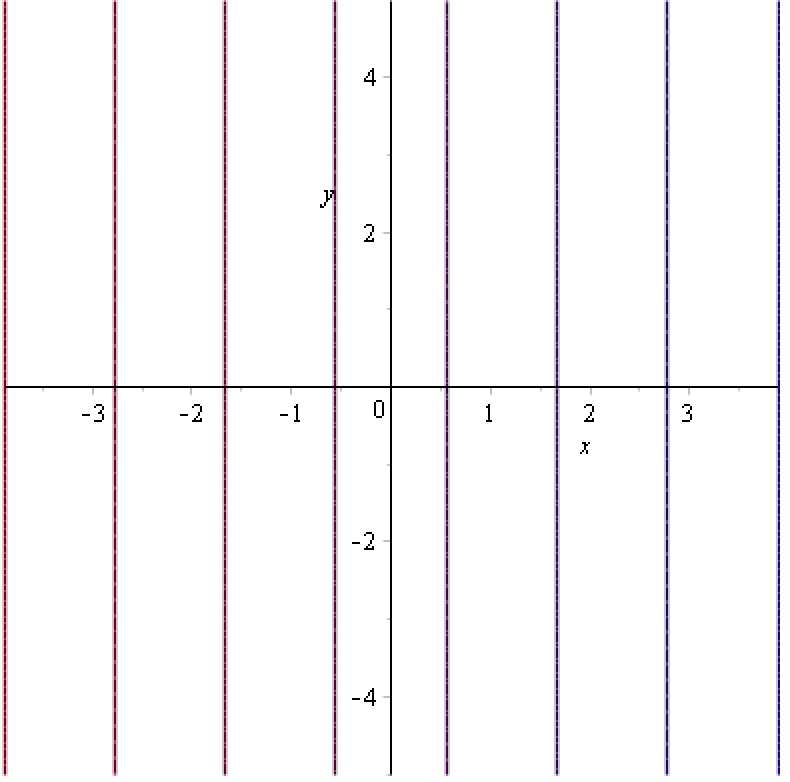
Step 2: write a function
f2 such that when you do the command contourplot(f2(x+I*y),x=-52..2,y=-2..2)
that you see the picture below.
Step 3: Display these two pictures on the same graph.
Step 4: For the functions $g(z) = 1/z$
plot $f_1(g(z))$ and $f_2(g(z))$ and display the plots on the same graph.
Explain what you see and compare your
answer to the graphs on the help page for conformalplot for their plot of
$1/z$. How does your plot differ from theirs (hey! if your plot doesn't look something
like the one on the help page then there is something wrong and you should go back to step 1)?
Explain the connection between your pictures and those that you see on this help
page. Do what you can to make your picture look more like theirs.
Question #2:
For $z$ a complex number, let $g(z) = \frac{1+2z}{1+z}$. Find a function
$h_1(z)$ such that $h_1(g(z)) = z$ and another (possibly the same)
$h_2(z)$ such that $g(h_2(z)) = z$. Use Maple to simplify your expressions and
show that your answers are correct. Explain your steps.
You should open up a new worksheet and start from scratch. You will have to save
your work in a file and upload that file on to the course
moodle. Your
solution should be a sequence of commands where it is easy to change the input
string and after you execute the sequence of commands you should have the
correct output string. Please add documentation to your worksheet to explain how it
works. Just a few sentences is sufficient, but imagine that you were opening up the
worksheet for the first time and wanted to know what it did. You will be marked down
if what you write is not clear and coherent.
You should finish your assignment before class Tuesday October 9 by 11:59pm. Assignments
submitted after this date will be assessed a penalty of 10% per day.