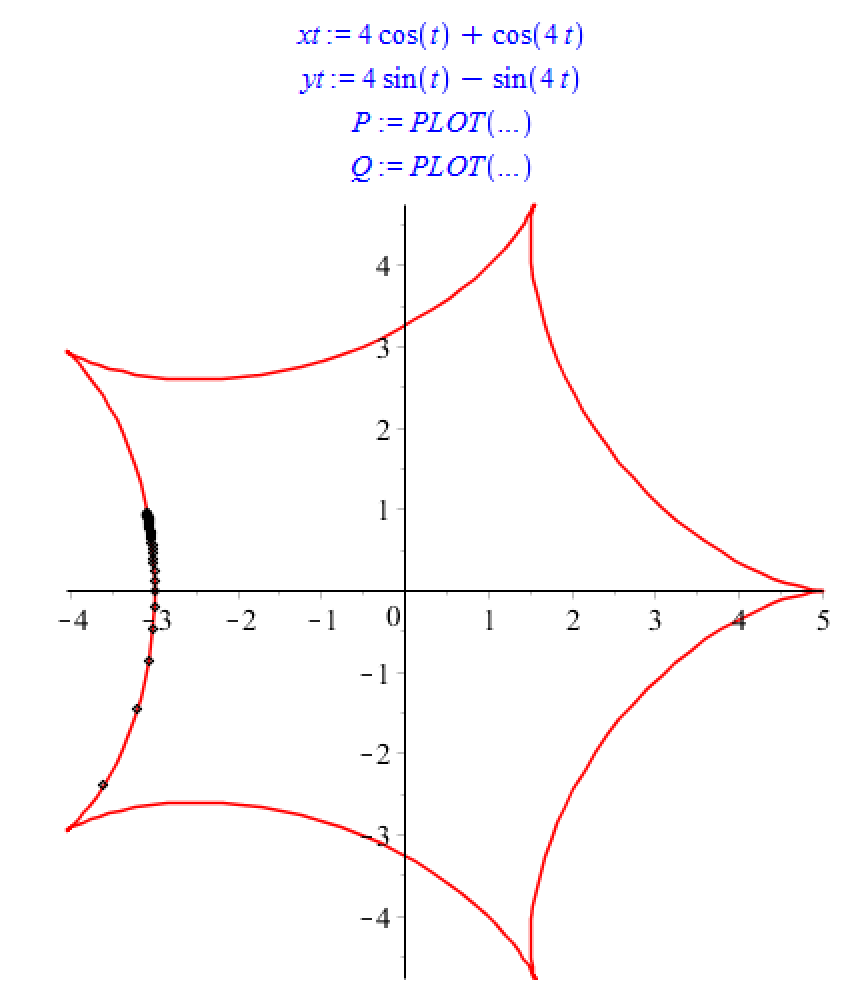
If you copy and paste the code below in Maple, you will see the
graph of black points on a red graph.
Describe as carefully as you can what this code is doing.
What does the function limitpoint do in general (in particular, tell me
what belongs on the description line of the function)?
What do the variables xt, yt, P and Q represent?
limitpoint:=proc(xt,yt,a)
description "describe in words what this function does. what is the input? what is the output?";
return [seq(subs(t=a+1/n,[xt,yt]),n=2..50)];
end proc:
xt:=4*cos(t)+cos(4*t);
yt:=4*sin(t)-sin(4*t);
P:=plot([xt,yt,t=0..2*Pi],color=red);
Q:=pointplot(limitpoint(xt,yt,4));
display(P,Q);