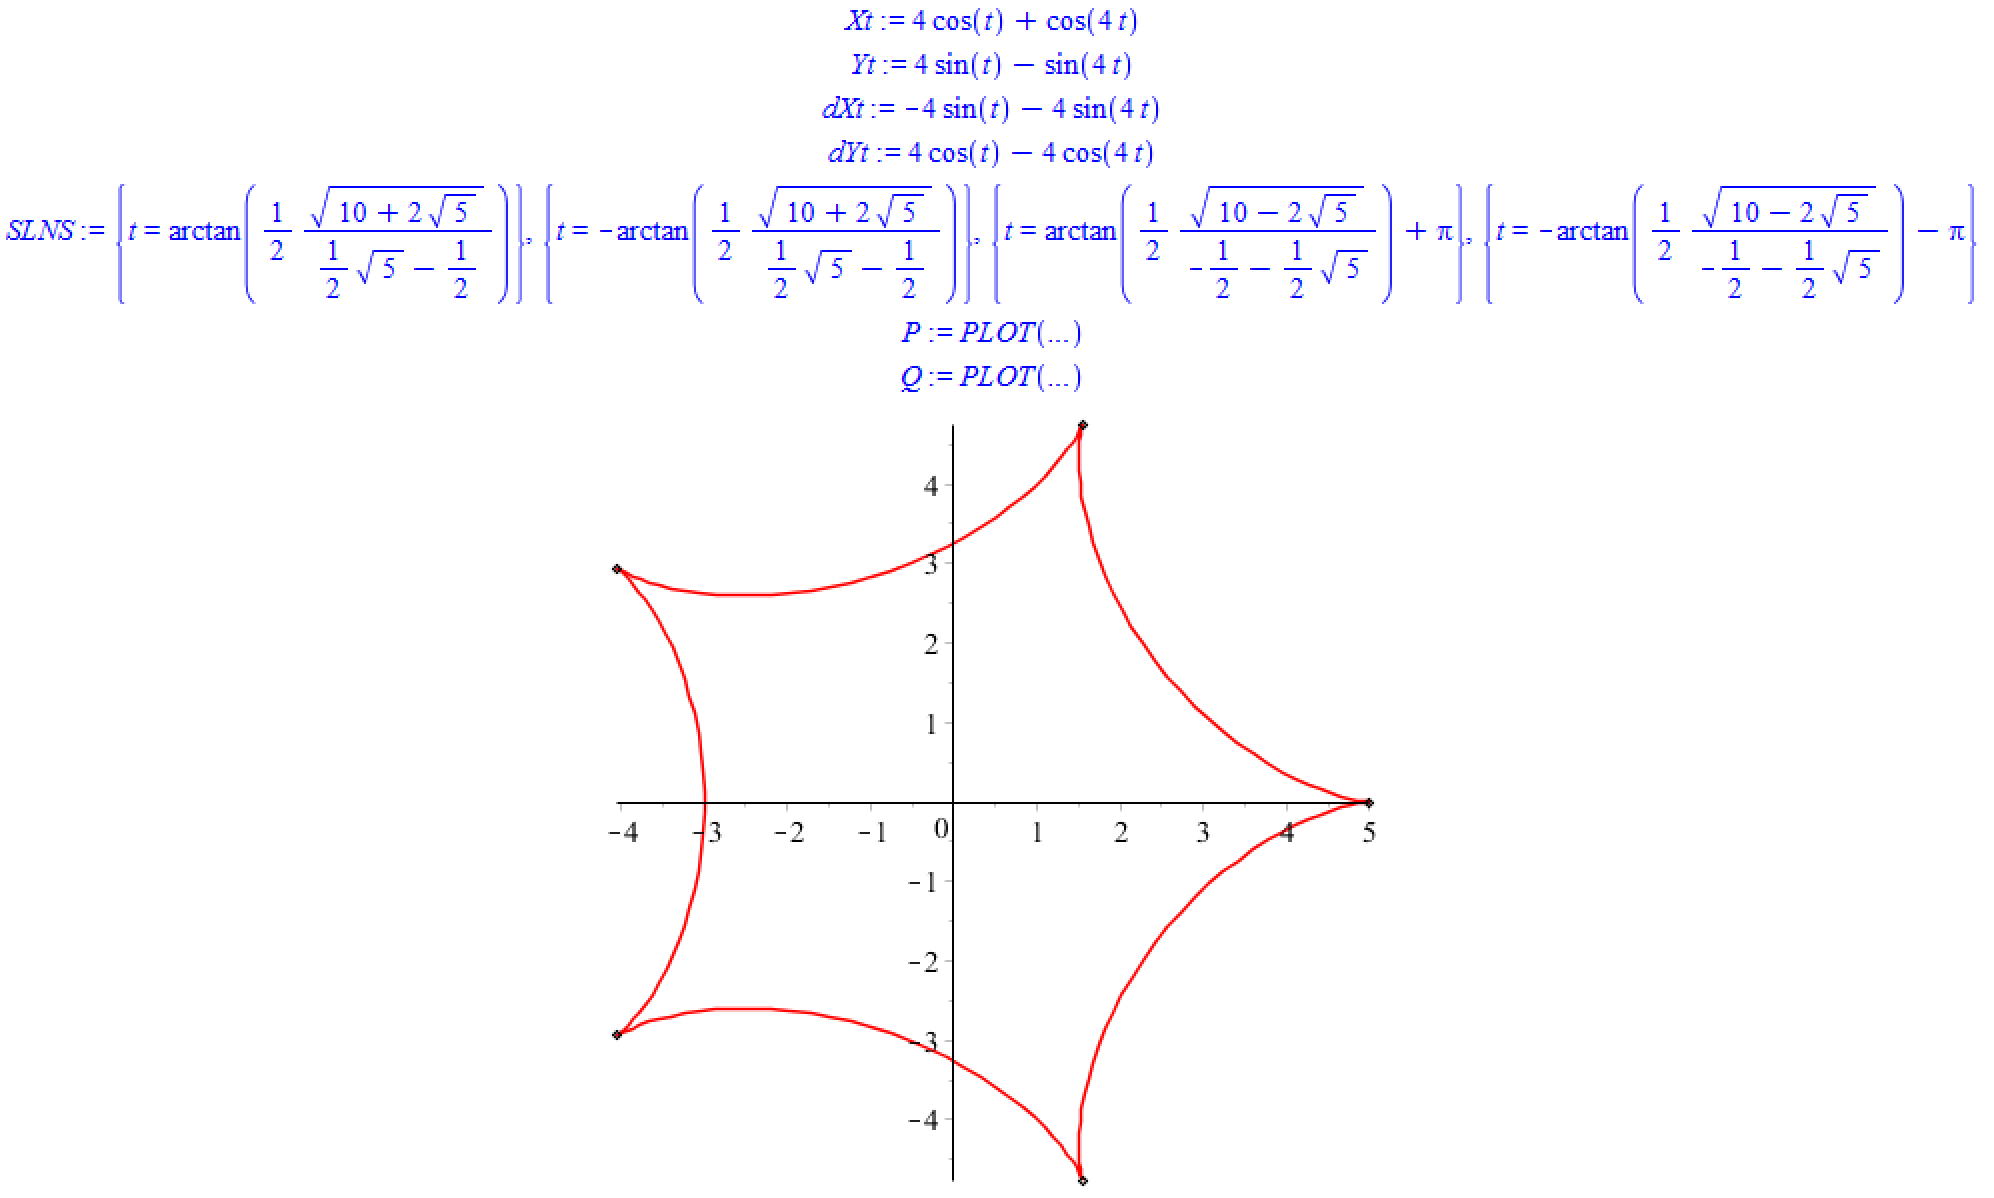
If you copy and paste the code below in Maple, you will see the
graph of black points on a red graph.
Describe as carefully as you can what this code is doing
(for instance, I don't just want you to tell me that SLNS is a
list of values, I want you to give me a description about what those values
represent in terms of the picture and why).
Give a description of the variables Xt, Yt, dXt, dYt, SLNS, P
and Q and explain why the code displays the picture below.